Rent Measurement: Towards Personalized Rental Data
“Rent is up again,” “That area is expensive,” “London is simply unaffordable”—these are common sayings before house-hunting in the UK. But these statements often differ greatly from the trends in your own area, city, or between renting and buying. This article aims to provide every UK renter with methods to measure rent and a full picture of rental trends.
Rent Freeze, House Price Surge
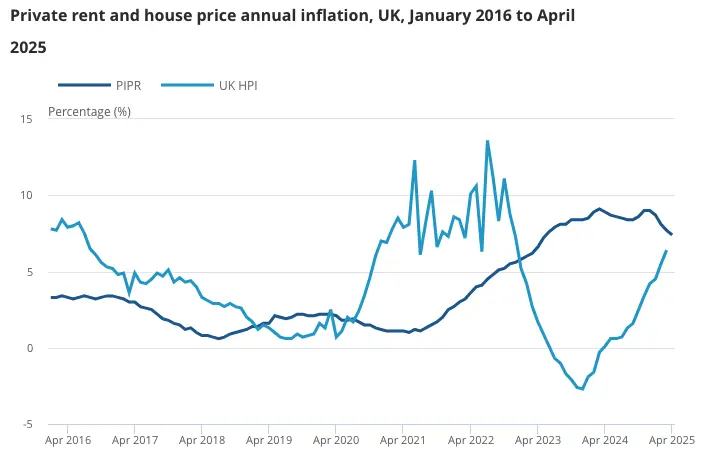
Across the UK, the annual rent growth rate reached 3% at the start of 2025, the lowest increase in recent years. For renters long squeezed by rising rents, this is a bit of breathing room. However, this slowdown doesn’t mean rents are cheap—just that the overall growth rate has slowed. Looking back at the three years since the pandemic, rents have been rising, just not as quickly now.
Do house prices and rents move together? Observing recent trends, UK rents only started to rise significantly in mid-2021, while house prices had already soared. By mid-2023, rents peaked and began to stabilize, but house prices started to fall. In other words, house prices rise and fall quickly, while rents are more stable. This is because rents reflect more of the fundamentals of living and the job market, while house prices are more affected by investment speculation.
Four Nations and England’s Internal Rental Analysis
The growth gap among the UK’s four nations is clear.
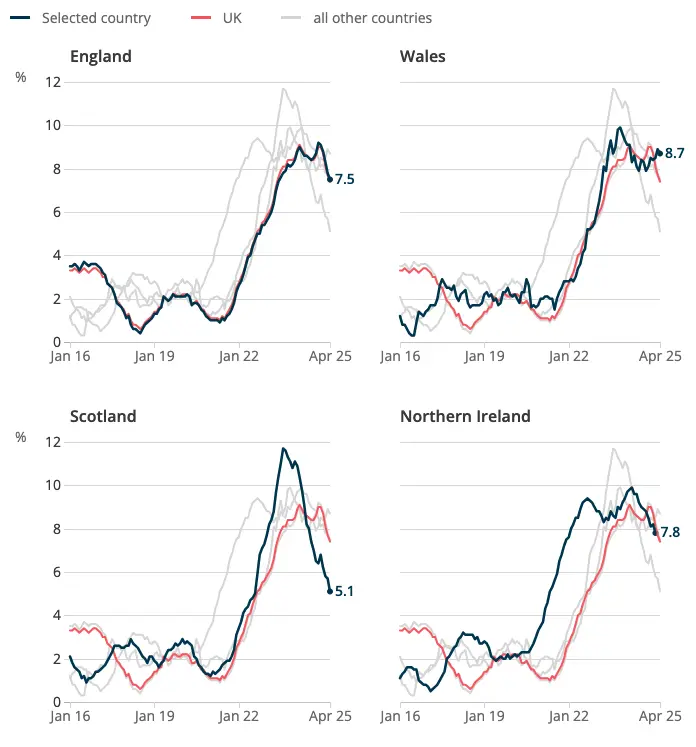
- Wales is currently the most resilient region, with an annual growth rate of 8.7% at the start of 2025, the only place still rising.
- Scotland once exceeded 11% annual growth in 2023, but also fell back the fastest.
- Northern Ireland and England remain high, with annual growth around 7.8%.
This shows that regional rental demand and adjustment speeds vary greatly.
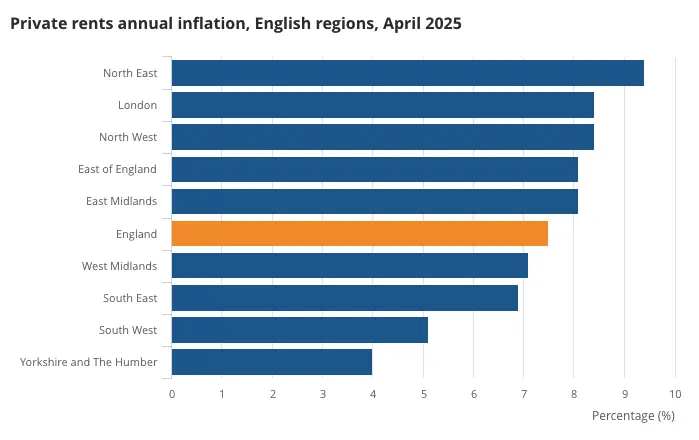
Looking just at England, the annual rent growth rate varies by more than double between regions.
- The North East has the fastest rent growth, exceeding 9%.
- London and the North West are also above the national average, close to 8%.
- Yorkshire and the Humber have the mildest increase, at about 4%.
City Analysis: Most Expensive ≠ Fastest Growth
Looking closer at major cities, the data tells a different story.
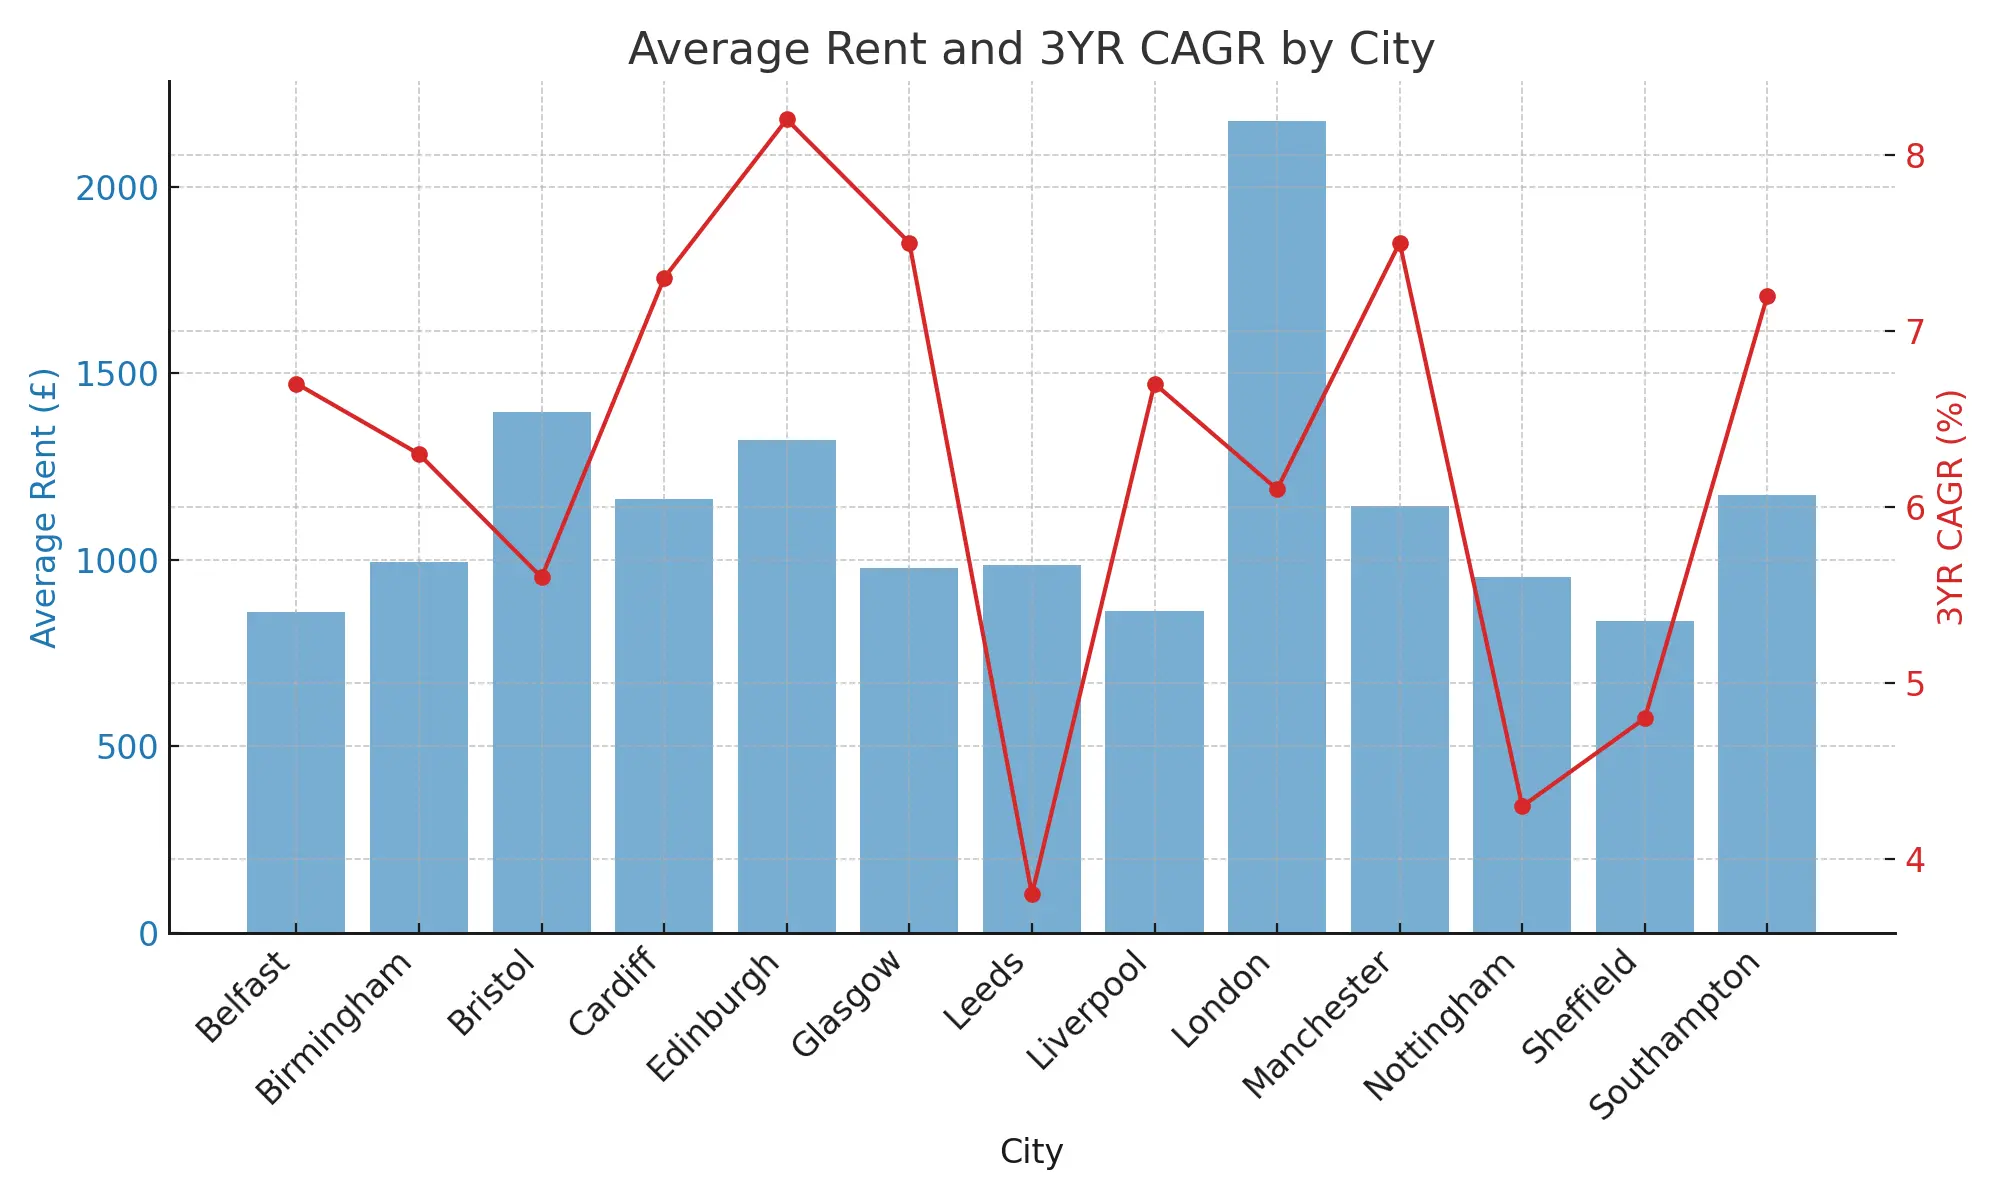
- London remains the most expensive city for rent in the UK, with average rent exceeding £2,000. But its three-year CAGR isn’t particularly high.
- Edinburgh has the highest three-year CAGR, over 8%.
- Manchester and Glasgow both have CAGR over 7%, showing that large cities still attract many movers and renters.
- In contrast, Leeds and Nottingham are more stable, with growth around 4.5%.
- Birmingham is a special case: although it’s the UK’s second largest city, both its rent and growth are relatively low.
How to Check Rent and Growth in Your Area?
The UK Office for National Statistics (ONS) provides two tools for renters to quickly understand their local situation:
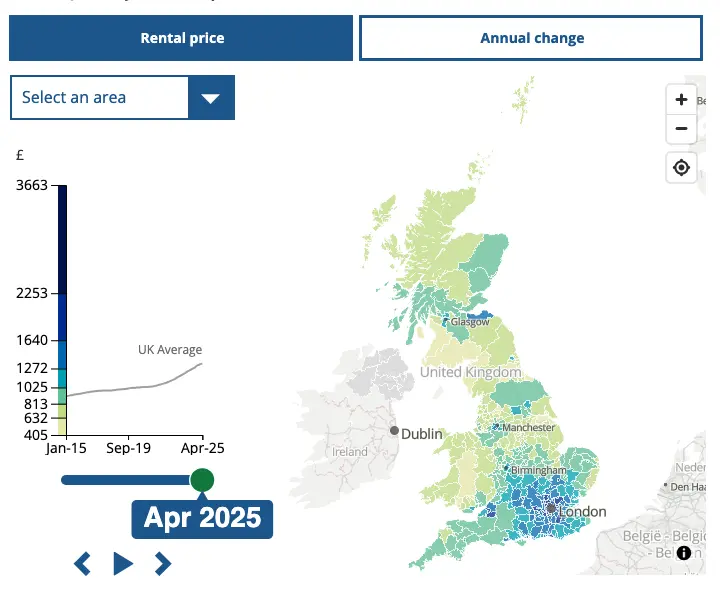
-
Regional Rent and Annual Growth Map: Click your area to see the current annual rent growth.
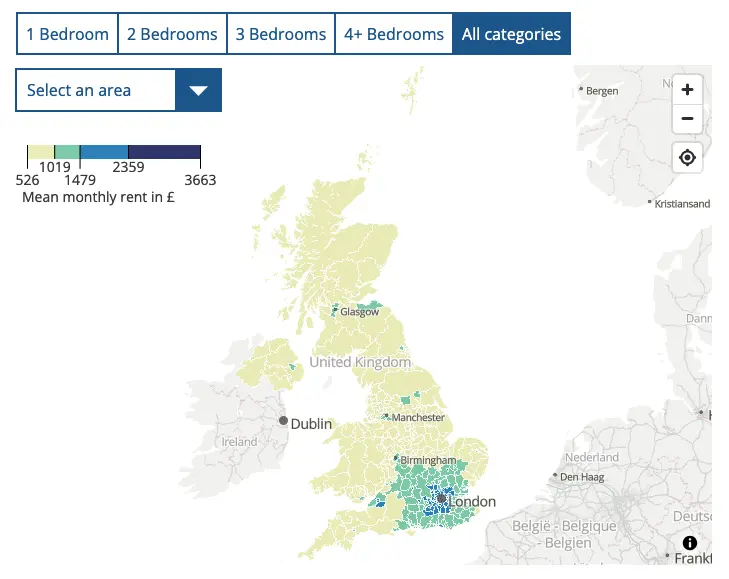
-
Regional and Property Type Average Rent Map: Select by 1-bed, 2-bed, 3-bed, etc., to check average monthly rent in different areas.
These interactive maps are updated monthly and are currently the UK’s most transparent and detailed public rental data sources. They’re great for evaluating where to move, when to change rentals, or understanding rent trends.
References
Private Rent and House Prices, UK - Office for National Statistics, Office for National Statistics, 20 May 2025.
Rental Market Report: June 2025 - Zoopla.
Image Credit
Photo by Ethan Wilkinson on Unsplash